
The 2026 Selective High School Placement Test attracted particular attention because the NSW Department of Education announced a major change late last year. For the first time, this cohort was admitted under a policy allocating 50% of places to boys and 50% to girls.
Debate about the policy continues. This report focuses instead on how admission outcomes for boys and girls varied across schools under the new policy, and how families can respond in future.
The data in this report comes mainly from feedback provided by our students. We thank every student and parent who supported this work.
The Department does not publish each school’s admission score or each child’s actual score. We therefore reviewed the Offers and Reserve outcomes reported to us and analysed them alongside students’ historical CTedu Trial Test results. The findings are provided as a reference only, and we apologise for any possible omissions or errors.
1. Analysis of Selective High Schools This Year
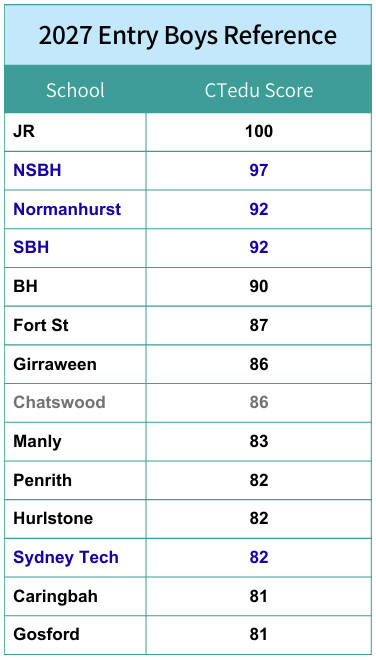
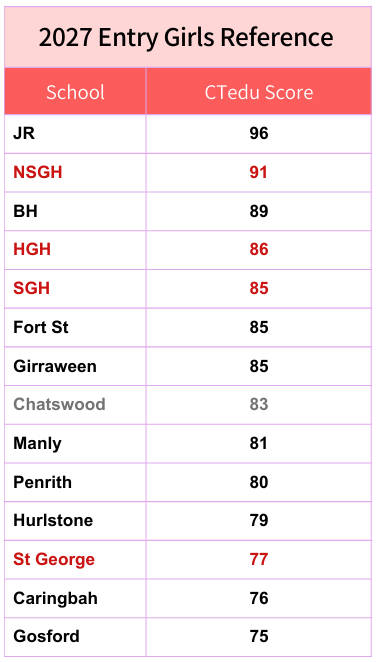
Note: These reference scores correspond to each student’s average score across their final five CTedu Trial Tests, out of 120. A reference score is set where the success rate for the target school, or a school in the same tier, reached 80%.
Detailed analysis
The 50% policy appears to have had a positive effect for girls. When we updated the Peak Climbing Chart late last year to show boys and girls separately, we expected girls’ reference scores to fall by about one mark from the previous year. This year’s middle-tier school results broadly matched that expectation, while schools at the top and lower ends fluctuated more than expected.
For boys, the biggest changes were at Normanhurst Boys and Sydney Boys, where the increase in reference scores exceeded general expectations. By contrast, the boys’ reference score for Baulkham Hills fell slightly. James Ruse and North Sydney Boys changed little, while the other fully selective schools generally rose slightly as expected.
A likely explanation is that, once co-educational schools moved to a 50–50 allocation, many families felt that using one preference for a boys’ school gave access to 120–180 places, while a co-educational school offered only 60–90 places for boys. To make fuller use of each preference, more families therefore leaned towards boys’ schools. This clustering effect lifted competition at those schools.
These findings describe this year only. Different changes may occur next year. For example, the relative positions of Baulkham Hills and the two boys’ schools will depend heavily on next year’s application choices, so families should not treat this year’s outcome as a fixed rule. More detailed preference advice appears in Section 3.
2. Other Points Worth Noting
2.1 Students Can Reach the Top from a Low Starting Point
We compared every student’s results from the beginning of their Trial Test practice with their final average before the official test. A total of 117 students improved from a starting point in the 60s—or even lower—to above 90 before the test. Several received Offers from top selective schools including James Ruse, North Sydney Boys and North Sydney Girls.
This strongly supports a point we have always emphasised: the starting point does not determine the finishing point. Consistent practice is what matters.
2.2 What This Year’s Cases Show About Writing
Among students who received direct Offers from high-entry schools such as James Ruse and North Sydney Boys, many were not in the Top 10% writing band. Some were in the Next 15% or Next 25% bands. As long as the other three subjects remain strong, writing appears to have a more limited effect than many families fear.
Parents can use CTedu’s Add-on Writing module to help assess this. If writing is not materially dragging down the child’s total score, there is generally no need for excessive concern.
2.3 Limitations of Band-Based Performance Reports
The Department’s current four-band performance report is too broad. The same set of four bands may cover a score range of more than 20 marks. Put another way, within a single band, a student near the top may be more than 1,000 ranks ahead of a student near the bottom. Bands therefore cannot accurately show a student’s true result.
For this reason, CTedu Trial Tests do not provide reports in four broad bands. We use exact scores and the Peak Climbing Chart to show students and parents their current position more clearly and encourage students to keep climbing towards the peak.
3. Recommendations for 2027 School Preferences
3.1 Spread the Three Preferences Across Different Tiers
We generally recommend using the school that matches the student’s pre-test Trial Test average—preferably including writing—as the second preference. Move one tier higher, roughly 8–10 marks, for the first preference, then choose a school one tier below the second preference as a fallback third choice.
Every child may perform better or worse than expected on the official test. With this strategy, a strong performance can open the door to a more aspirational school, while a weaker performance still has a fallback. In our statistics this year, the success rate for the one-tier-lower fallback preference exceeded 97%, indicating that the strategy was effective.
3.2 Account for Score Fluctuation
If a student’s Trial Test scores still fluctuate substantially in the final stage, we recommend setting the overall preference level a little more conservatively, or at least making the third preference more conservative. Large fluctuations often indicate limited consistency, whether due to mindset or gaps in knowledge, and either can affect performance in the official test. Parents should take this into account.
3.3 Consider Other Relevant Factors
Some well-prepared families also arrange private school applications or secure access to a good local public high school. In that situation, selective school preferences can be slightly more ambitious. Even if the fallback preference does not work out, Plan B remains available, and the child may also experience less exam pressure.
3.4 Understanding Reserve Bands
Reserve outcomes attract considerable discussion each year. Under the official definition, Reserve Bands A to F represent the approximate period in which a student might receive an offer: A is roughly within one month, B within two months, and so on.
In terms of numbers, each of Bands A to E is generally small, sometimes containing only single-digit numbers of students. Band F is often much larger—roughly comparable with the number of direct Offers. For example, a school with 120 places may also have more than 100 students in Band F. The chance of reaching Band F is therefore generally low.
There is one special situation. After the December deadline—3 December this year—students who already hold a selective school Offer leave the process. The Reserve list then contains only students without any Offer, some of whom may be planning to attend a private or local school. This smaller group can continue receiving Offers during the Christmas holidays or the first term of Year 7. Reserve movement can jump quickly across bands at that stage, but this is not the usual pattern.
It is also important to understand that how far and how quickly a Reserve list moves depends mainly on whether other families with Offers decline them. Historical data cannot reliably predict this.
For Year 5 families currently preparing, the most important priorities are careful planning, consistent Trial Tests and serious Review. Keep climbing higher on the Peak Climbing Chart and the chance of a direct Offer next year will be greater. Keep going!