
Choose the performance band for each subject in the report.
For each subject, choose one of four bands: Top 10%, Next 15%, Next 25%, or Lowest 50%.
Select a performance band for all four subjects to see the estimate.
Estimated total score out of 120
Indicative Selective School Competitiveness
Boys Reference
Girls Reference
School positions are indicative references only, not official cut-off scores. Entry requirements vary from year to year depending on student performance, available places and other placement factors.
These references reflect the general placement process. An outcome that differs substantially may be associated with an offer under the Equity Placement Model, which holds up to 20% of places at each selective high school for eligible students.
That score range is wider than you expected, isn’t it?
And that is the important part of this calculator.
Two students can receive exactly the same four performance bands while their underlying scores are several marks apart. In some cases, a student whose bands appear lower may still receive an offer from a more competitive selective school.
A performance band shows the broad range in which a student performed. It does not reveal the student’s exact position within that band. When four broad bands are combined, the uncertainty becomes even larger.
The school references above make that difference easier to see: within one possible score range, the competitive picture can look very different.
So, are performance bands a bad way to report results?
Some parents may feel that performance bands are not clear or precise enough, especially when they want to understand how close a student may have been to a different outcome. The NSW Department of Education and some families may consider this broader reporting approach helpful because it places less emphasis on exact scores, reduces unnecessary comparison and competition, and helps protect students from the pressure of being defined by a single number.
But during preparation, a broad band is often not enough. If a student stays in the same band for several months, they may actually have made substantial progress within that band — or they may have barely moved at all.
The performance band alone cannot tell you which one happened.
During preparation, progress matters more than a label.
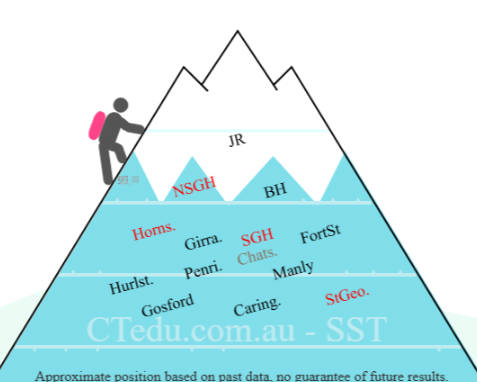
CTedu provides a simple and intuitive benchmark through its Peak Climbing Chart. The chart shows a student’s current level and the selective schools that broadly correspond with that performance. It gives families a practical reference when reviewing school goals, while giving students a visible sense of progress.
Instead of seeing preparation as a collection of isolated scores, students can see themselves gradually climbing towards a clear destination. Regular CTedu Trial Tests make it possible to follow that journey and identify whether performance is improving, stable or moving away from the intended goal.
See how CTedu can support steady progress throughout selective school preparation.
See How CTedu Helps Students Progress →About the calculator
This calculator is an educational estimation tool, not an official NSW Department of Education score converter. It uses a simplified statistical model based on assumed score distributions and performance-band percentiles. Actual test scaling, student performance and placement outcomes may differ.